
Drive savings and service improvements with Navisphere Insight
In an ever-changing market, data-backed intelligence is crucial to optimizing your supply chain. Navisphere® Insight is an intuitive, dynamic analytical tool that identifies opportunities to improve transportation spend, help ensure on-time performance, and gain critical insight.
Powered by our information advantage and drawing from the largest dataset in the freight industry, Navisphere Insight uses data science algorithms to turn your raw data into actionable insights—helping you make proactive decisions that drive better outcomes for your supply chain.
Global data and scale
Built by and for supply chain experts, Navisphere Insight uses data science algorithms and the largest dataset in the freight industry to transform your raw data into valuable insights.
Focused reporting and analytics
Gain critical insight to make timely, proactive decisions that lower transportation costs and support on-time performance. Whether you need analytics at a quick glance or want to drill down into exact shipments and orders, Navisphere Insight provides supply chain analysis for your business.
Information you need, all in one place
Easily access and compare transportation spend and performance data all in one place—from your desktop or mobile device. Navisphere Insight updates in real-time, so you have access to the information you need, when you need it.
Key metrics to meet your business’s unique needs
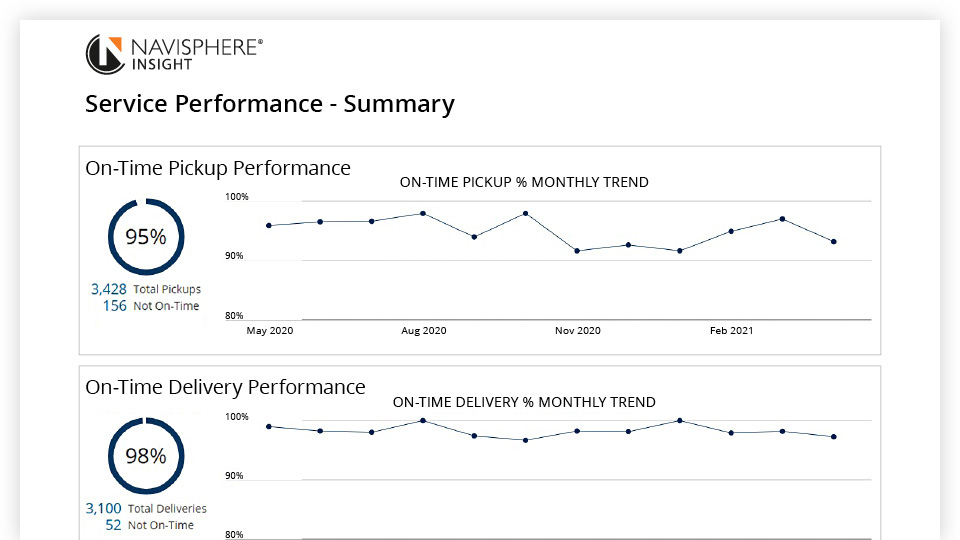
Measure on-time pickup and delivery
Examine performance results at the shipment and order level by mode, date, time, location, lead time, and dwell time. Is one warehouse not performing up to par? Looking to monitor precise deliveries to avoid retail chargebacks? Direct your attention where it is needed most to mitigate risk and save money.
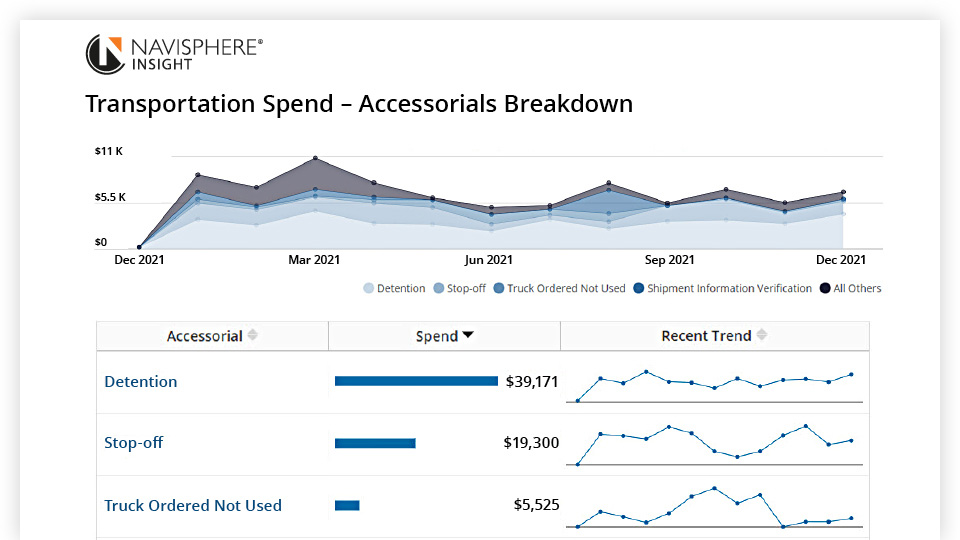
Compare expense trends
Review expenses at the shipment and order level, drilling down to freight charges, fuel, taxes—and even accessorial fees. Measure by the pound, mile and more. Check individual detention charges to make timely adjustments that improve your transportation spend.

Compare your rates to DAT averages
The transportation industry is evolving, and so must your spot freight. Through our partnership with DAT—an industry leader with the most accurate, freight rate data—you can now compare your rates in detail with the market average. Then, using our information advantage, deconstruct your rates to see potential savings opportunities. Market Rate IQ™ makes it easier than ever to improve service for spot freight.
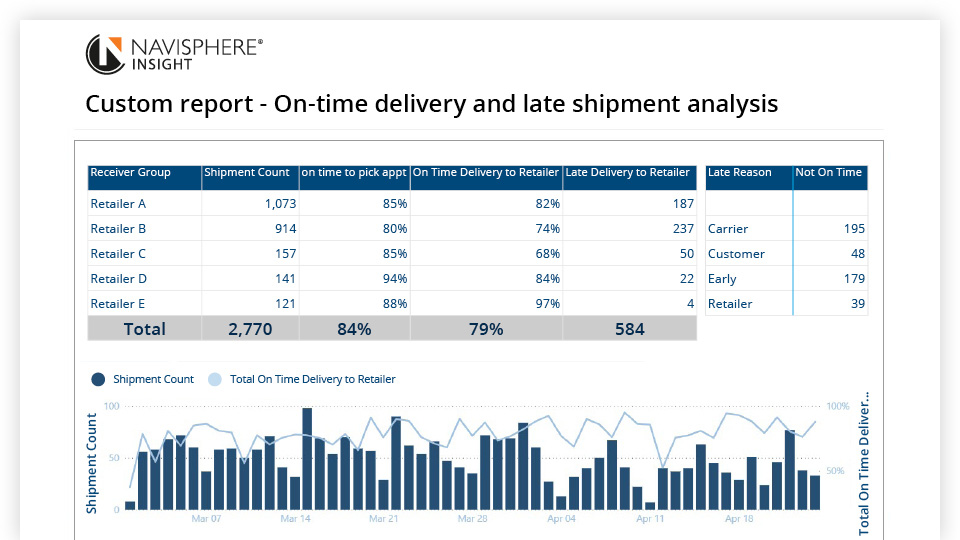
Customized reports for your unique business
Let our team build you a customized report. Whether you need analysis related to a specific weight threshold, claims, or reasons for late shipments, our supply chain technology experts can create reporting to include your critical supply chain analytics.
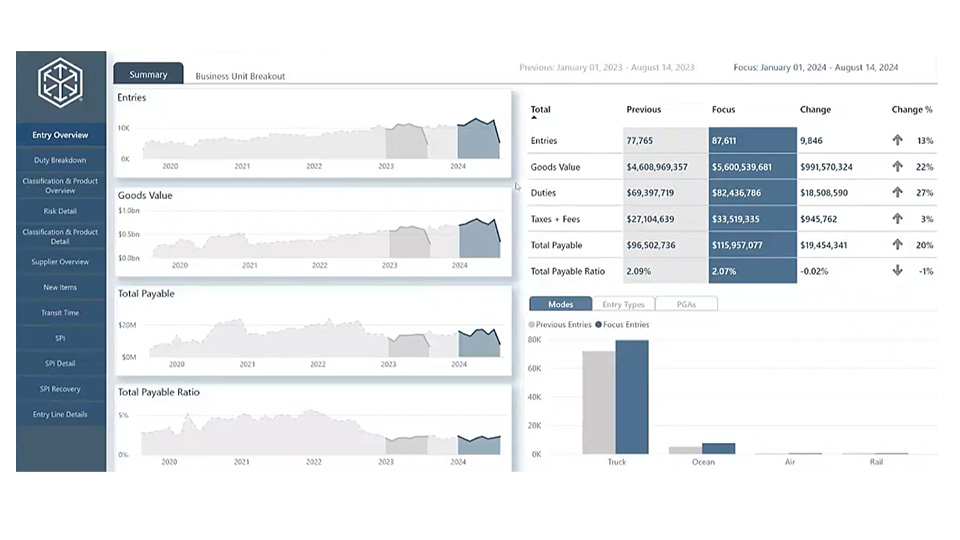
Manage customs activity with U.S. Customs Analytics
When it comes to customs technology that can keep up with your imports, Navisphere U.S. Customs Analytics offers exactly what you need. With it, you can develop your own big picture. Stay connected to customs entry data and uncover strategic insights into your customs spend, compliance risk areas, and potential improvement opportunities.
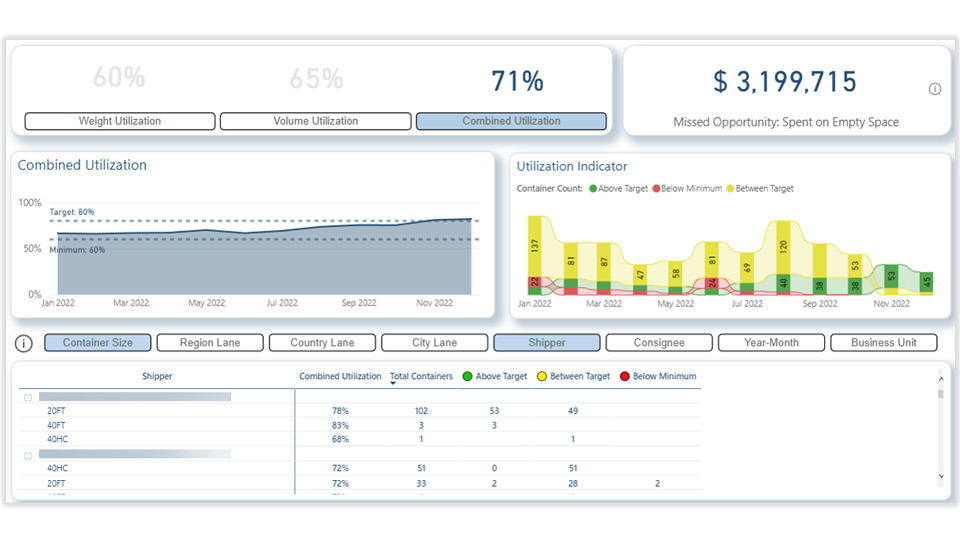
Evaluate and improve container utilization
See how much you spend on empty space for full container load (FCL) shipments. Evaluate your habits using a real-time dashboard that uses your own minimum and maximum settings. It’s easy to measure your performance across providers, container sizes, and lanes—to make informed decisions for future shipments.
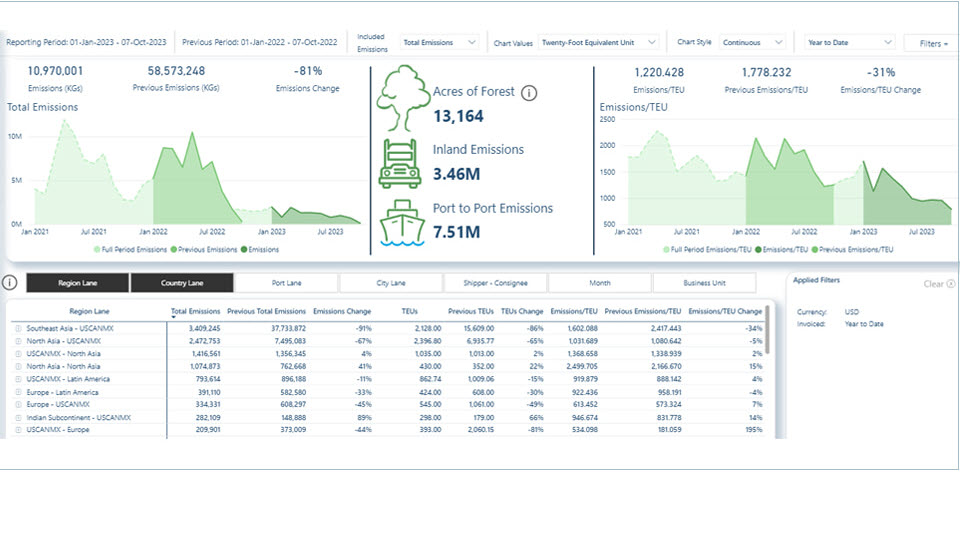
Monitor emissions changes over time
Quickly see how your global supply chain’s emissions evolve and use your total emissions data—by region, country, port, city, and chargeable rate—to determine which routes make the most sense for your needs.
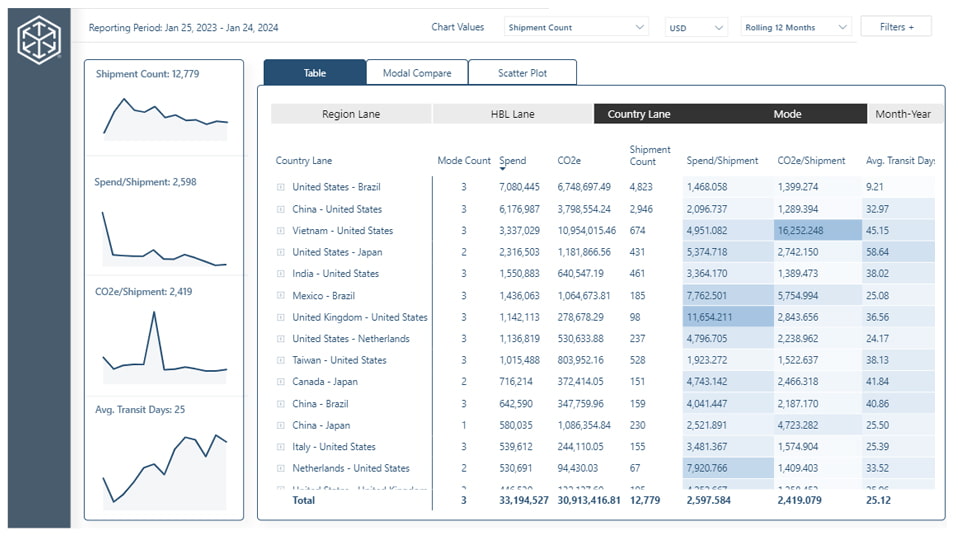
Compare modes globally
See how modal conversions can change spend, transit time, and total CO2 emissions—use this information to make smart decisions based on your company’s priorities.
What our customers say
Navisphere Insight helped us consolidate data and eliminate inaccuracies. The setup process was quick and easy, and C.H. Robinson's training empowered our users to proactively seek out data to provide solutions to complex problems.
Ryan Householder, Logistics Manager
Hometown Food Company
Ready to get started?
Connect with one of our experts to receive access or learn more about custom reporting options.