As we wrap up 2019, it’s not too late to prepare for the conditions of the changing transportation market and review expectations for the coming year. Here’s a brief update about the transportation market in the final quarter of 2019.
The evolving truckload market cycle
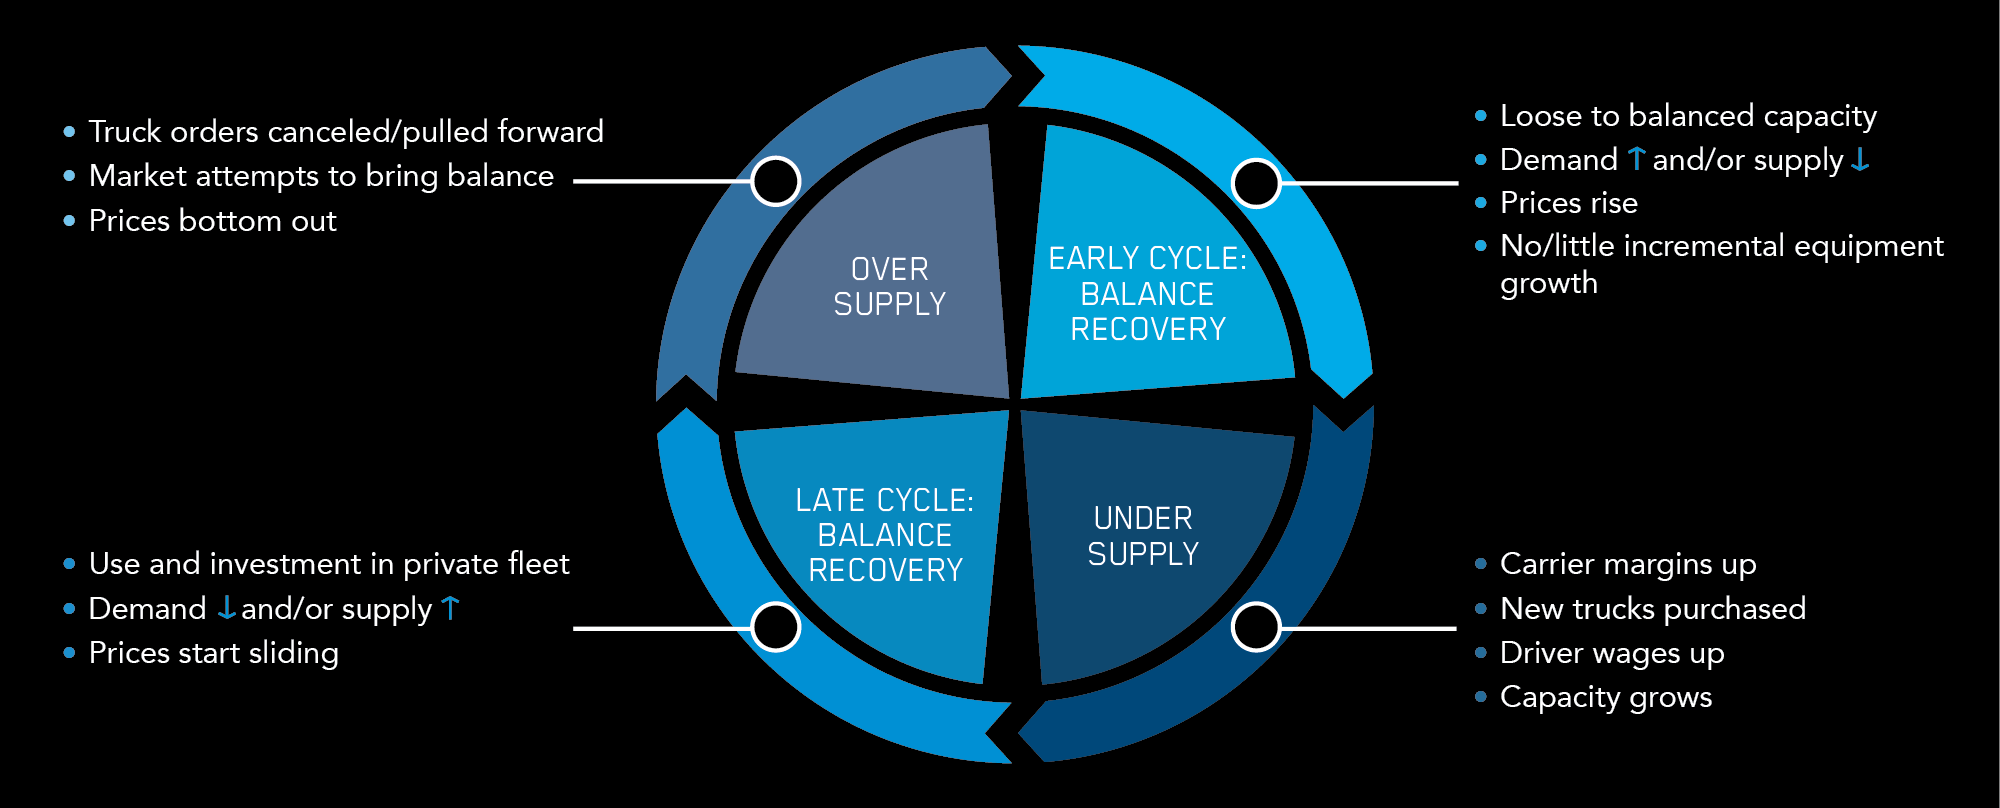
The market historically sees periods of undersupplied capacity, a transition to oversupplied capacity, and a transition back to undersupplied capacity.
Figure 1: The classic cycle of the U.S. truckload market sector

The duration and magnitude of these cycles varies based on freight demand and supply injection or contraction (from both the for-hire and private capacity pools).
This year, we saw strong North American freight volume. According to the ATA, the committed for-hire market is estimated to finish up 1.5% in volume Y/Y, but due to spot market weakness, the combined market could be down 3-5% Y/Y.* While this sounds alarming, 2019 has been a very good freight year when compared to the years prior to the exceptional 2018.
Summarizing the market in recent years
Cyclical supply response lags the market tension. Below summarizes the recent years and where we may end up in 2020:
- 2016: Cited as flat freight or recession year following 2015 capacity expansion. As a result, oversupplied.
- 2017: A growth year for volume. A lagging response to 2016 of continued supply contraction, initiated a tight market in Q3.
- 2018: Exceptional year for freight volume paired with continued supply contraction into Q1. In the second half of 2018 supply growth began to balance the market.
- 2019: Continued Q4 2018 softening of Y/Y volume growth. Supply continued to expand as new truck orders were delivered leaving the market oversupplied.
‘The market is the market’ as they say. No participant has enough scale to shape the market as even the largest shippers and carriers are single digit participants. Forecasting the phases of the cycle requires discerning what level of tension or slack will exist in the market and how long each phase of the cycle will last. Neither of which are usually successfully anticipated.
What to consider in terms of capacity availability
Investment and divestment of trucks often lags the market experience. Market analysts such as ACT Research offers analysis that helps market participants understand new orders, purchases, and their timing. Typically this fragmented market adds capacity after tension is felt and removes capacity well after slack is present. With so many independent participants in both the for-hire and private fleet markets, we tend to see over corrections on each end of the cycle.
Truck and trailer sales
To date, new truck and trailer sales are slowing as the back orders of 2018 were delivered well into 2019. A leading indicator of 2020 is the order pattern of 2019. Orders have been at or below the volume estimated to replace permanently retired tractors. October was a strong order month followed by a lower November. Analysts are watching these orders in an effort to get a better sense of how the investment of new tractors will increase or decrease the fleet.
Used truck exports
A key relief valve to oversupply is the export of used trucks. ACT Research forecasts about 14,000 tractors will be exported in 2019. Slightly below the 10-year average and well below correction years like 2017 when around 23,000 trucks were exported. In 2020, we will possibly have two key economic headwinds to large export levels; a strong U.S. dollar and a slowing global economy.
Growth of for-hire capacity and private fleets
While for-hire capacity grew in 2018 and 2019, ACT Research and the National Private Truck Council estimate private fleets grew 10-12% in this time. Private fleets are no less than 50% of the capacity; that is a material contribution to the supply side of today’s market.**
What’s influencing demand?
According to Bob Costello, chief economist of the American Trucking Association, the key industry segments in today’s market include manufacturing, housing, and retail.
The Purchasing Managers Index (PMI) experienced growth through July, however, it has been below 50 for several months now.*** The PMI is considered highly correlated to less than truckload (LTL); and when it is declining, LTL tonnage tends to recede.
Housing has been up and down in 2019. It struggled going into Q3, but has improved in October. Both van and flatbed truckload services serve this sector.
Ecommerce continues to experience meaningful growth, helping the LTL industry. Large-format ecommerce freight continues to use LTL service, contributing to demand and LTL price stability.
Consumer sentiment continues to be resilient by most analyst reports. With strong employment data, economists regularly cite the consumer as the brightest spot of the economy and forecast.
Trade’s influence on demand
Most analysts cite that completing the trade negotiations with China and ratifying USMCA could have a positive effect on the economy of North America and increase freight flow.
Inventory levels’ influence on demand
The inventory to sales ratios published by the U.S. Census Bureau continue to show levels that are higher than optimal. When levels are lower, there tends to be more movement of freight in supply chains.
What today’s market conditions could indicate for 2020
Looking at a variety of analysts, forecasts for 2020’s surface transportation range from ‘similar to 2019’ to ‘progressing toward supply-demand parity in the second half of 2020.’
Watch the injection or contraction of new trucks along with freight volume patterns. The analyst community seems to be coalescing around flat to slightly down capacity and flat to slightly up demand.
C.H. Robinson offers a multimodal, seamless, global suite of services that match customers’ business needs and help them succeed in any market cycle. We have people you can rely on who act like an extension of your team and bring deep expertise to your business. Connect with one of our experts today.
Footnotes:
* Bob Costello, Chief Economist of the American Trucking Assoc. Blended 2019 forecast assumes spot market is ~15% of the total freight market.
** ACT Research October Freight Flows report
*** Institute of Supply Management, Purchasing Managers Index. A value of 50 is the threshold of growth or contraction for manufacturing.
Figures:
1 Visual adapted from ACT Research market cycles June 2019 trucking report.


