 Télécharger les diapositives
Les marchés américains du transport de lots complets restent soumis à des pressions en termes de capacité
Publié: jeudi, juin 04, 2026 | 09:00 CDT
Mis à jour
Marché au comptant américain
Le mois de mai a continué à démontrer l'impact d'une réinitialisation du marché par l'offre. La semaine de contrôle routier, au cours de laquelle de nombreux transporteurs préfèrent garder leurs camions hors de la route, a été la plus serrée que nous ayons observée pour cette période du point de vue du rapport charge/camion et a été marquée par une grande volatilité des prix.
Alors que d'autres événements ou fêtes sont influencés par la demande de transport routier à des degrés divers, la semaine de contrôle routier est un signal plus fort sur l'état de l'offre. (Pour en savoir plus sur l'impact de la semaine de contrôle routier 2026, regardez l'édition de mai de la vidéo C.H. Robinson Edge).
Le mois de juin verra une augmentation de la demande de fret saisonnier jusqu'à la fête du 4 juillet, en raison du chevauchement de la saison des fruits et légumes et de la saison des boissons. Nous continuons à surveiller les tendances de la production manufacturière et de l'offre des transporteurs, car ces deux éléments auront probablement un impact sur l'expérience du marché au cours du second semestre 2026. Nous n'avons pas modifié nos prévisions pour 2026 et elles restent à l'étude.
Pour en savoir plus sur les cycles du marché du transport de lots complets, les variables qui les influencent et les conditions actuelles, consultez notre article de blog : The New Research Behind Truckload Market Cycles-and What Shippers Should Watch (Les nouvelles recherches sur les cycles du marché du transport de lots complets et ce que les expéditeurs doivent surveiller).
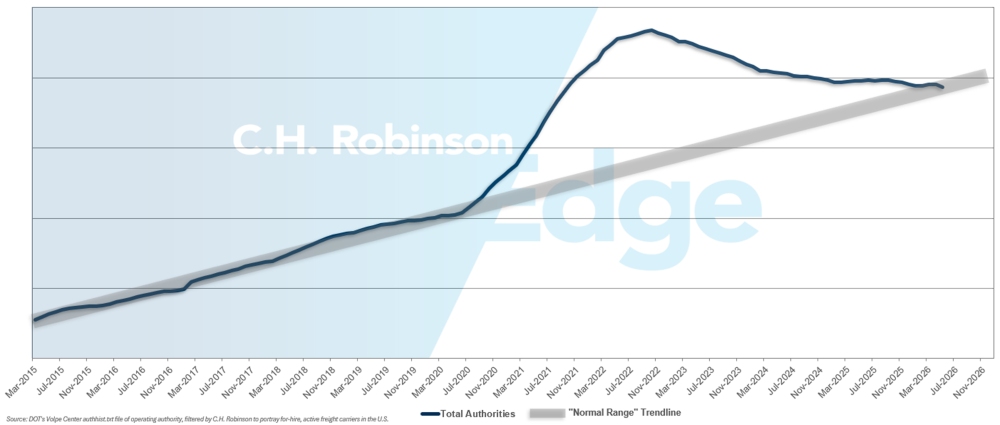
Autorités chargées des transporteurs pour compte d'autrui
La tendance à la baisse de la capacité de camionnage s'est poursuivie en mai, passant plus clairement du haut de la fourchette historique au milieu de la fourchette historique. Cela confirme que l'excédent de capacité après le boom du fret de l'ère COVID a été sensiblement réduit.
Autorités chargées des transporteurs pour compte d'autrui
Environnement de transport contractuel de lots complets
Les informations suivantes proviennent de C.H. Robinson Managed Solutions™, qui sert un large portefeuille de clients dans divers secteurs d'activité.
La profondeur du guide d'itinéraire est un indicateur de l'étendue des stratégies de sauvegarde qu'un chargeur doit mettre en œuvre lorsque les fournisseurs de transport retenus rejettent un appel d'offres. Une profondeur de guide de 1,0 correspond à une performance parfaite et une profondeur de 2,0 à une performance extrêmement médiocre. Les défaillances de l'itinéraire se produisent lorsque l'itinéraire a été épuisé et qu'aucun transporteur préféré n'accepte le fret, ce qui a pour effet d'envoyer la cargaison sur le marché au comptant.
Comme le montre le graphique suivant, la profondeur du guide de route est restée stable à un niveau historiquement bas pendant trois ans (2022-2025). À partir de la fin novembre 2025, les premiers signes d'un marché en mutation sont apparus lorsque la profondeur du guide de route a dépassé 1,3 pour la première fois depuis des années. Depuis lors, les guides d'itinéraires sont restés confrontés à la diminution de la capacité, à une série de tempêtes hivernales et à l'augmentation des prix du diesel.
Pour le mois de mai, la profondeur de guidage pour l'ensemble des expéditions en Amérique du Nord était de 1,48, ce qui est moins bon que le mois précédent (1,32), inversant l'amélioration constatée en avril et démontrant l'impact de la semaine de contrôle routier. Le RGD moyen de 1,48 est le plus élevé depuis 2022.
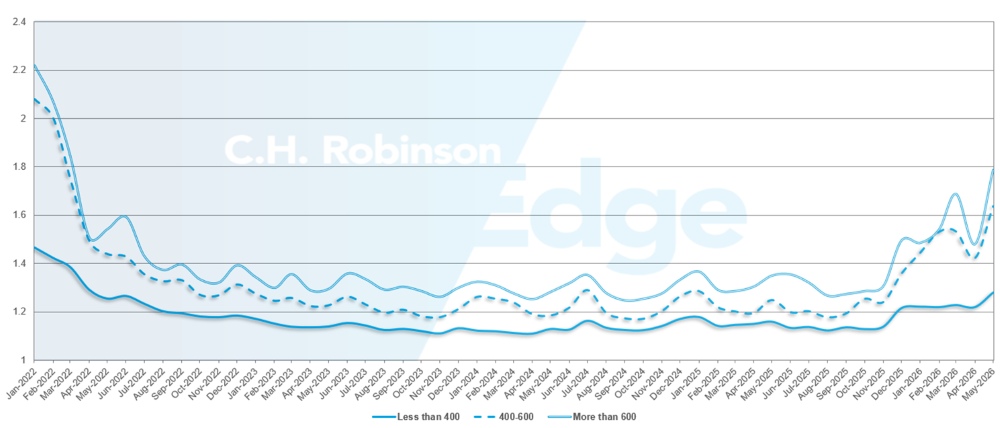
Du point de vue du kilométrage, les longs trajets de plus de 600 miles ont enregistré les pires performances en matière de guide routier, avec une profondeur de 1,78 en mai. C'est 20% de moins qu'en avril 2026 (1,48), et 32% de moins qu'en mai 2025 (1,25). Cette performance des expéditions longue distance est révélatrice des difficultés d'approvisionnement propres aux transporteurs axés sur le fret routier à longue distance.
Alors que les transports courts de moins de 400 miles continuent d'être les plus performants, la profondeur pour mai 2026 était de 1,28, ce qui représente la plus forte augmentation d'un mois sur l'autre pour ce groupe de transport depuis la première fluctuation du marché en décembre 2025.
Guide des itinéraires en Amérique du Nord : mesures de profondeur : Par longueur de trajet
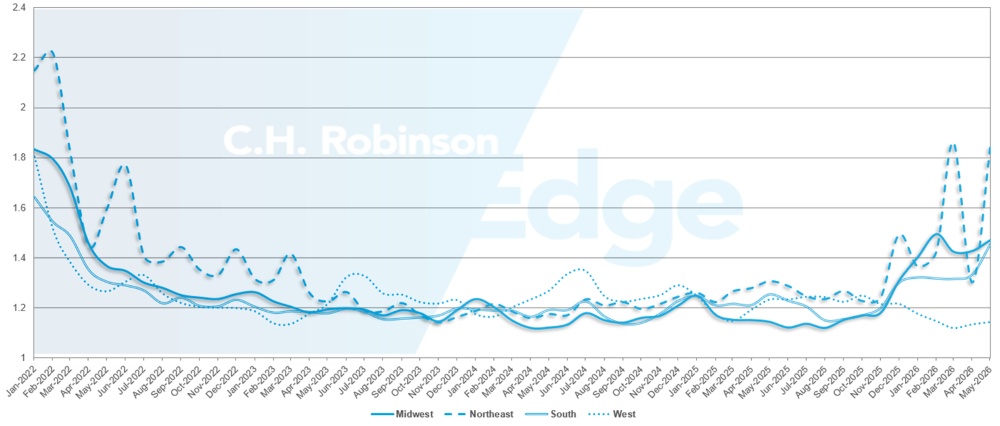
Géographiquement, l'Ouest reste la région la plus performante, puisqu'elle a connu la plus faible variation de toutes les régions, avec une baisse de 0,8% par rapport au mois précédent. Le nord-est a connu la plus forte variation mensuelle, avec 40% de plus qu'en mai. La profondeur des guides d'itinéraires, qui varie entre 1,14 et 1,84, est de plus en plus sollicitée dans toutes les régions. Cette fourchette nous rappelle que le marché du fret américain n'est pas monolithique et que les expériences peuvent varier d'une région à l'autre.
Guide des itinéraires aux États-Unis - mesures de profondeur : Par région
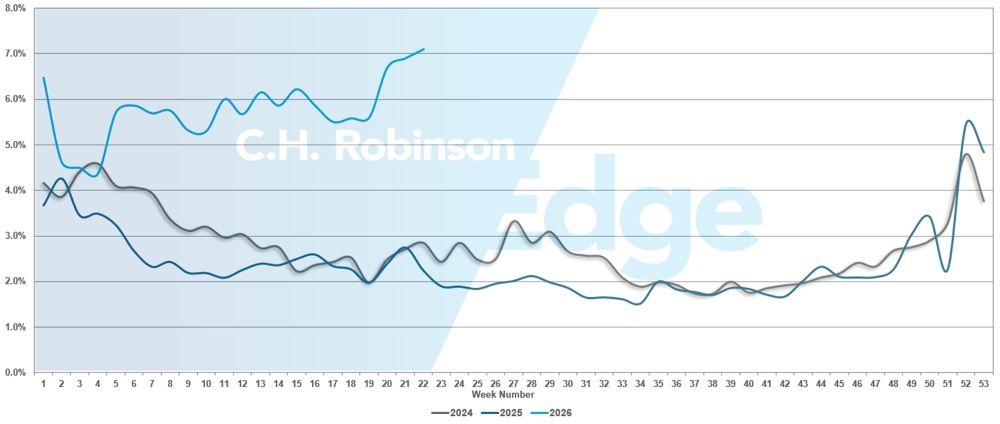
Les défaillances des guides routiers ont atteint 7% en mai, démontrant l'impact de la semaine de contrôle routier 2026 sur le marché du transport de lots complets. Il s'agit du taux d'échec le plus élevé depuis les vacances du Nouvel An 2026.
Défaillances du guide routier américain
Transport frigorifique de chargement de camion complet
Côte Est des Etats-Unis
Les conditions frigorifiques le long de la côte Est varient du nord au sud. Les expéditions de rattrapage après la semaine de contrôle routier et le Memorial Day se sont modérées, la plupart des voies reprenant des schémas saisonniers plus typiques.
La capacité dans le Sud-Est est limitée et reste sensible aux pics de demande à court terme, en particulier dans les couloirs à forte densité de produits. La Géorgie, en particulier, continue de subir un resserrement lié au mouvement des produits résiduels, ce qui peut créer des poches de prix élevés à la sortie. La capacité s'améliore pour les chargements sortants du Nord-Est, tandis que les taux commencent lentement à se normaliser à mesure que les arriérés de fret sont résorbés.
La dynamique d'exécution continue de favoriser le fret bien structuré. Les chargements ayant des horaires réguliers, des exigences de manutention minimales et un délai d'exécution suffisant sont couverts de manière efficace, tandis que les appels d'offres accélérés ou pour le jour même sont soumis à une plus grande variabilité en termes de coûts et de capacité disponible. Cela reflète un marché stable en apparence, mais qui nécessite une planification disciplinée pour éviter les perturbations.
À mesure que le mois de juin avance, les marchés de la côte Est devraient rester bifurqués en raison de la récolte saisonnière. Dans l'ensemble, la capacité est disponible, mais la tarification et la flexibilité deviennent plus importantes pour l'obtenir, en particulier sur les marchés des produits du Sud-Est et là où il y a un déséquilibre dans le fret de retour.
Centre des États-Unis
Les conditions du marché frigorifique dans le Mid-North se sont quelque peu détendues à la suite de la semaine de contrôle routier, l'activité se rapprochant des normes saisonnières. À ce stade, aucune perturbation immédiate à grande échelle n'est attendue en dehors des poussées typiques liées aux vacances, ce qui laisse présager un environnement plus stable à court terme sur ces voies.
En revanche, le Texas continue de connaître des taux élevés et des conditions de capacité plus strictes. Les marchés de la région restent très compétitifs, sous l'effet conjugué de l'expédition de produits, de la dynamique transfrontalière et des contraintes globales de l'offre. Par conséquent, le marché fonctionne avec une marge d'inefficacité limitée.
Dans l'ensemble, le Texas reste le marché réfrigéré le plus perturbé et le plus élevé de la région, d'une année sur l'autre. Alors que les conditions ailleurs ont commencé à se normaliser, le Texas reste un point focal pour les capacités serrées, les prix élevés et la volatilité continue, ce qui en fait une zone clé à surveiller pour les expéditeurs à mesure que les saisons de pointe des produits et des boissons progressent.
Les caractéristiques des envois jouent également un rôle plus important dans l'exécution. Le fret direct avec des exigences de manutention minimales permet d'obtenir des capacités plus rapidement, tandis que les expéditions plus complexes, telles que les enlèvements ou les livraisons multiples, voient leurs coûts augmenter de manière disproportionnée et les délais de couverture s'allonger. Cette divergence s'accentue à mesure que les transporteurs donnent la priorité à l'efficacité et à l'utilisation des actifs.
Côte ouest des États-Unis
Les conditions du marché frigorifique dans l'Ouest ont largement reflété les tendances observées dans la région centrale, avec un resserrement significatif observé pendant la semaine du Roadcheck et le cycle d'expédition du Memorial Day. Au cours de cette période, de nombreuses voies ont connu une accélération significative des taux, avec des augmentations de 40% ou plus dans certains corridors à forte demande.
Si les capacités restent accessibles, l'exécution dépend de plus en plus de la planification et des délais. Les chargements réservés à l'avance avec un préavis suffisant continuent de bénéficier de prix plus favorables et d'une couverture cohérente. En revanche, les appels d'offres pour le jour même et le fret de récupération se heurtent à la fois à des coûts élevés et à une disponibilité limitée des transporteurs, ce qui témoigne d'un marché qui reste très réactif aux pics de demande à court terme.
Au fur et à mesure que le mois de juin avance, on s'attend à une légère baisse des prix par rapport au pic de la période des fêtes. Cependant, tout mouvement à la baisse devrait être limité. Les retards accumulés lors de l'augmentation récente de la demande sont toujours en cours de traitement, ce qui retarde la normalisation des coûts. Cette dynamique pourrait repousser tout soulagement significatif jusqu'à la fin du cycle d'expédition du 4 juillet, qui commence généralement à prendre de l'ampleur dans la deuxième moitié du mois de juin.
Du point de vue des régions et des produits de base, plusieurs facteurs clés liés aux produits continuent de façonner les conditions du marché :
- La Californie du Nord devrait rester élevée grâce à des volumes de produits soutenus et diversifiés, ce qui maintiendra la demande de produits réfrigérés sortants à un niveau élevé.
- Nogales, en Arizona, continue de monter en puissance avec la saison des pastèques, ce qui réduit encore la capacité sur les principales voies du sud-ouest.
- Washington entre dans la saison des cerises au début du mois de juin, ce qui devrait entraîner une pression accrue sur les tarifs et des temps de séjour plus longs, car les volumes augmentent et les installations ont un débit plus élevé.
Sur la plupart des marchés occidentaux, la capacité est techniquement disponible, mais l'accès est de plus en plus lié au prix. En pratique, les camions sont disponibles mais souvent à un prix élevé, en particulier pour les délais de livraison courts ou le fret à forte demande. Cette dynamique contribue à l'augmentation des cas d'échec du guidage routier, car les taux contractuels sont inférieurs aux conditions actuelles du marché et davantage de fret est poussé sur le marché au comptant.
Dans l'ensemble, les conditions de réfrigération sur la côte ouest restent élevées et très sensibles aux flux de produits et aux variations de la demande à court terme, l'exécution dépendant de plus en plus de la discipline en matière de planification et de la flexibilité des prix.
Chargement à plat
Le mois de mai s'est avéré particulièrement volatile pour le marché du transport à plat, en grande partie à cause des effets combinés de la semaine du contrôle routier et des vacances du Memorial Day. Ces événements sont venus s'ajouter à des capacités déjà limitées et ont contribué à de fortes variations des prix et de la disponibilité des camions dans plusieurs régions clés. Les ratios nationaux de chargements de plateaux par camion ont culminé à environ 87 pour 1 au cours du mois, marquant les niveaux les plus élevés observés depuis 2022.
Malgré ces conditions élevées, les tendances historiques suggèrent que le marché commence à dépasser sa période de tension maximale. Le mois de mai représente traditionnellement le point le plus contraignant du cycle des plates-formes, les conditions se stabilisant généralement jusqu'en juin avant de s'alléger davantage après les vacances du 4 juillet. Alors que la capacité devrait rester limitée tout au long des mois d'été, les indicateurs actuels suggèrent que le marché a probablement dépassé sa phase de volatilité la plus aiguë.
La dynamique du marché continue de refléter une activité soutenue sur le marché au comptant. Les volumes de fret au comptant restent élevés par rapport au fret sous contrat, tandis que les rejets d'appels d'offres continuent d'être supérieurs aux niveaux observés ces dernières années. En avril, les taux spot pour le transport de lots plats ont augmenté d'environ 25% par rapport à l'année précédente, et le mois de mai a continué sur la même lancée. En juin, les conditions devraient rester élevées par rapport aux moyennes historiques, même si la volatilité des prix devrait commencer à s'atténuer au fur et à mesure que le marché progresse dans les dernières phases de la haute saison de construction.
Les prix des contrats ont également continué à se raffermir. Les tarifs des contrats de transport à plat, hors carburant, ont augmenté de plus de 5% d'un mois sur l'autre en avril et de plus de 9% d'une année sur l'autre. Cette situation reflète la discipline tarifaire constante des transporteurs et leur besoin de compenser l'augmentation de leurs dépenses d'exploitation.
Le rythme du resserrement devrait ralentir à l'approche du milieu de l'été. Les déséquilibres régionaux, la variabilité des conditions météorologiques et l'activité de construction saisonnière en cours à l'approche des premiers stades de la saison des ouragans devraient continuer à provoquer une volatilité périodique sur les principales voies de circulation.
Dans cet environnement, la planification et la flexibilité restent essentielles pour maintenir les niveaux de service et gérer les coûts de transport :
- L'allongement des délais, lorsqu'il est possible, peut améliorer la couverture et réduire l'exposition à la prime au comptant.
- La flexibilité des fenêtres d'enlèvement et des dates d'expédition permet d'élargir le choix des transporteurs.
- La flexibilité des équipements, lorsqu'elle est possible, peut améliorer l'accès aux capacités. L'utilisation d'un marchepied ou d'une remorque Conestoga à côté d'un plateau standard peut augmenter la couverture.
- Le maintien d'une coordination étroite avec votre gestionnaire de compte C.H. Robinson peut vous aider à surveiller les tendances régionales et à positionner votre fret de façon proactive.
La voix du transporteur
Observations d'un échantillon représentatif des transporteurs contractuels du réseau C.H. Robinson, le plus important d'Amérique du Nord.
Marché
- Les taux ont tendance à augmenter, les transporteurs se montrant disposés à renoncer à un fret sous-évalué.
- Le recours accru aux mini-offres et les ajustements plus fréquents du réseau reflètent les perturbations continues du guide d'acheminement.
- Les chargeurs s'adaptent en planifiant plus tôt, en optimisant leur réseau et en s'efforçant de devenir un "chargeur de choix".
Conducteurs
- La disponibilité des conducteurs continue de diminuer, les pénuries étant les plus prononcées chez les détenteurs de CDL expérimentés.
- Les transporteurs deviennent plus sélectifs dans le recrutement des conducteurs, rejetant une part plus importante des candidats en raison des normes de conformité et de qualification.
- Le taux de rotation augmente à mesure que les salaires et les incitations augmentent, ce qui accroît la volatilité de la disponibilité de la main-d'œuvre.
Équipement
- Les transporteurs qui quittent le marché, la réduction de la flotte et la consolidation réduisent le nombre d'équipements disponibles sur le marché.
- De nombreuses flottes fonctionnent à plein régime ou presque, ce qui limite la flexibilité pour absorber les pics de demande ou les perturbations.
- La hausse des coûts du carburant, de l'assurance, de l'entretien et des pièces détachées continue de limiter les réinvestissements dans des équipements plus nombreux ou plus récents.
 Des analyses exploitables sur le transport de marchandises