The recent volatility on the U.S. truckload market has been much discussed since a series of early winter storms in November and December 2025 revealed that truckload capacity had decreased to a level that could not effectively support freight demand through a disruption. This market shift has brought the conversation about truckload market cycles back to the forefront after an extended period of the market being “stuck” in an extended recovery period.
For years, freight shippers have known the truckload market is cyclical. Capacity tightens, rates rise, conditions loosen, rates fall, and then the cycle repeats. Historically, these cycles have been rather predictable within a few months; most shippers, carriers, and brokers had their preferred rules of thumb to inform them that market conditions were changing.
Despite having more available data than ever before, various factors have impacted and evolved supply chains since 2020, resulting in ambiguity within the marketplace. With market cycles no longer clearly apparent, it's critical to dive deeper to not only properly define a market cycle but, more importantly, how to anticipate shifts between each phase of the cycle.
Recent academic research out of MIT’s Center for Transportation & Logistics, sponsored by C.H. Robinson, has made meaningful progress on both fronts. The result is a repeatable, data-driven framework that defines each phase of the truckload market cycle and identifies leading indicators that can help forecast when the current phase is likely to shift.
Why this matters for shippers
Without a reliable way to identify cycle transitions, most shippers are faced with a variety of different viewpoints, many of which are based on emotional or historical beliefs which can result in:
- Misaligned pricing and expectations
- Service failures
- Broken budgets
This research sought to address that challenge by properly defining the cycle with industry agreed-upon measures and validating which external metrics move before rates do.
A data-driven definition of the truckload cycle
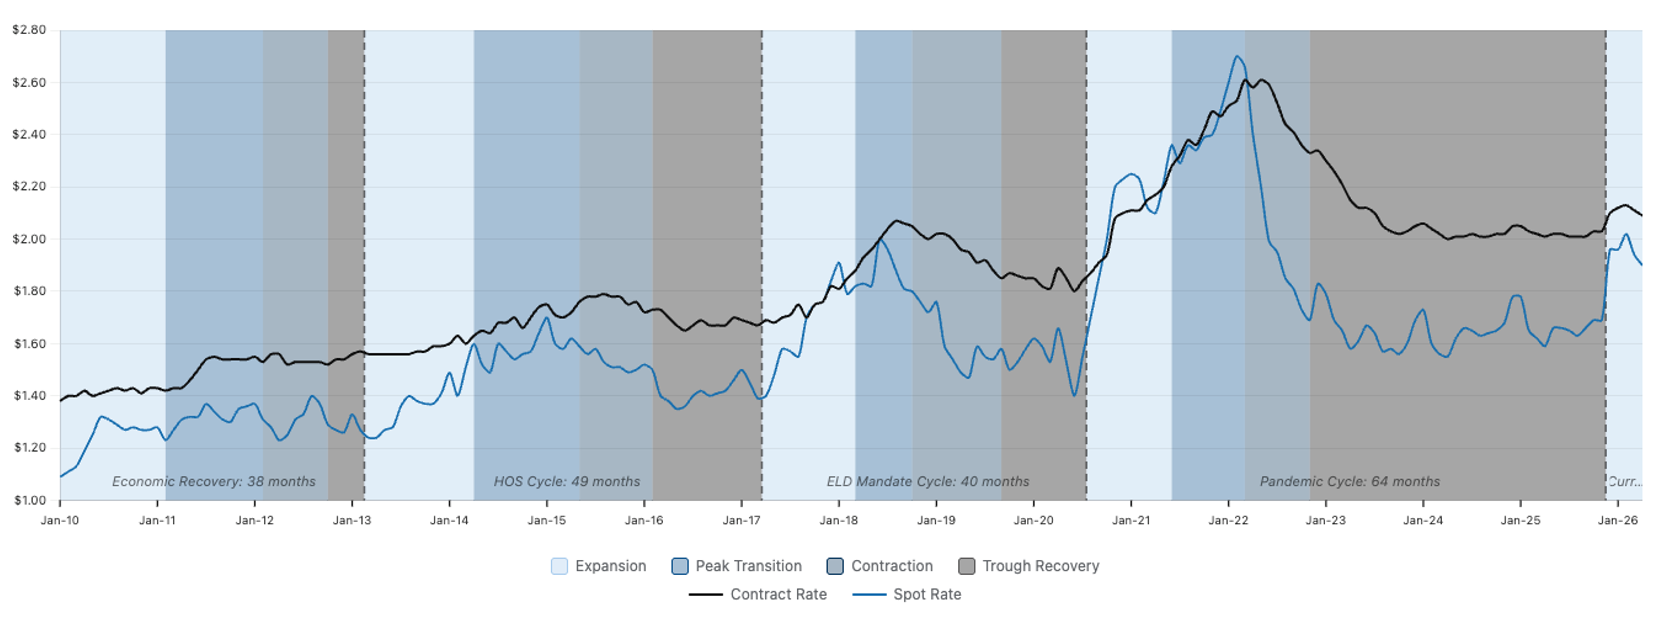
After combing through historical data, interviewing dozens of expert freight practitioners across the industry and surveying over 100 shippers, researchers identified that the truckload market can be objectively segmented into four phases using the behavior of:
- Spot rates
- Contract rates
- The spot–contract rate relationship (often called the spot premium)
Many industry experts have historically defined the market cycle only through the lens of the spot market, but this has proven to be an incomplete perspective. Approximately 80% of all truckload freight (depending on market conditions) is procured on a contractual basis, so including contract pricing and the interplay between contract and spot—which experiences much more volatility from seasonal and disruption events—is more indicative of the full marketplace experience.
The four phases of the truckload market cycle
1. Expansion
Expansion begins when both spot and contract rates turn positive on a year-over-year basis. This signals that demand is strengthening and/or capacity is tightening. Spot rates typically rise first, pulling contract rates higher with a lag.
2. Peak Transition
Peak Transition occurs when the pace of year-over-year spot and contract rates slow while still remaining positive. Said another way, rates continue to rise year-over-year but the rate of rise has peaked. Capacity has largely caught up with demand, and the market is approaching balance. This is often the most challenging phase for shippers to identify in real time.
3. Contraction
Contraction starts when spot rates turn negative year over year at a growing pace while contract rates are decreasing sequentially. Capacity begins to exceed demand, pricing pressure eases, and spot rates fall faster than contracts.
4. Trough Recovery
Trough Recovery is marked by year-over-year spot and contract rates decreasing but at a slowing pace or staying flat. The market remains loose, but conditions are stabilizing. Historically, this is when spot rates bottom out before the next expansion begins.
From definition to forecasting: what actually leads the market?
Defining the cycle is only half the battle. The more valuable question is: what moves before spot and contract rates change?
Researchers evaluated dozens of economic and industry variables to determine which ones consistently lead to changes in truckload pricing. While many proved to have a good leading correlation (e.g., retail inventory to sales, PPI, industrial production, Class 8 production metrics), three categories stood out as the most powerful predictors of future cycle shifts:
1. FMCSA carrier authorities (supply signal)
Increases in total carrier authorities as well as new entrants into the market reflect carrier confidence with marketplace improvement. Decreases, on the other hand, reflect elevated carrier competition with insufficient demand to warrant it.
2. Housing starts (demand signal)
Housing activity consistently leads truckload demand, particularly for dry van and flatbed freight. Changes in housing starts tend to show up in spot rates 6–9 months later, making this a valuable early warning indicator.
3. Route guide depth (capacity signal)
Route guide depth (RGD) is an indicator of how far a shipper needs to go into their backup strategies when providers reject a contractual load tender. RGD captures emerging capacity stress in real time and before sustained spot rate changes occur.
What this means in practice for shippers
While the study provides deeper insights to build a more robust forecasting model, monitoring these three primary metrics provides a quick and solid method to provide what the industry has historically lacked: foresight. Rather than reacting to rate spikes or capacity shortages after they happen, shippers can monitor a short list of indicators to assess where the market is today and when it will shift next.
The takeaway
Truckload market cycles are no longer ambiguous and open to emotional interpretation. They can be defined objectively and monitored systematically.
With defined phases comprising the cycle, and by tracking a set of proven leading indicators, shippers can gain a clearer, earlier view of when the market is likely to shift. This won’t completely eliminate uncertainty, but it does replace guesswork with an explainable, data-driven approach. As research with MIT on this topic continues, C.H. Robinson will provide new methods of forecasting shifts within the market cycle.
Current conditions
Today’s truckload market illustrates why a structured cycle framework matters. By traditional demand measures, the market remains in an extended Trough Recovery. Through April 2026, freight volumes are steady, consumer spending has softened modestly, and growth remains limited outside select industrial segments. Under past definitions, this might suggest a prolonged loose market; however, the cycle is turning due to supply side factors.
After the surge of pandemic era carrier entrants, carrier authorities have steadily declined since 2022 and have now returned to the historical range needed to support the economy. Elevated operating costs, tighter enforcement, regulatory pressures, and limited fleet reinvestment have reduced capacity elasticity, and these pressures are expected to continue since they are structural in nature.
Execution metrics reflect this shift. Route guide depth has begun deteriorating after holding at favorable levels for multiple years, signaling increased carrier selectivity and reduced surplus capacity inside contractual networks. Historically, these signals tend to move before sustained changes in spot and contract pricing.
As a result, the market is in Expansion—not because demand is surging, but because carrier supply has tipped the scales out of balance. For shippers, this highlights the need to monitor various inputs beyond just their own demand, making early recognition of cycle shifts increasingly important.
For a deeper understanding of the market cycle, contact your C.H. Robinson account manager and consult our monthly C.H. Robinson Edge Report for up-to-date insights.
Related links