 Download slides
Truckload market pressure builds to summer peak
Published: Wednesday, July 01, 2026 | 09:00 am CDT
On this page
U.S. spot market
The tightened carrier supply in the market has been the primary driver of increased truckload rates this year. This reduced carrier supply has been especially impactful during disruptive events, such as Roadcheck Week, causing rates to spike much higher than historical averages. After the Fourth of July holiday, demand is expected to temper slightly, as seasonally expected. While this should allow for some rate relief through the month of July, it will still result in strong increases year over year (y/y).
The result is an increase to the 2026 spot rate forecast. Unlike prior updates, this revision reflects not only elevated realized costs but a higher baseline entering the summer period, requiring a further upward adjustment to the 2026 cost curve and a stronger increase through the holiday season to close out the year.
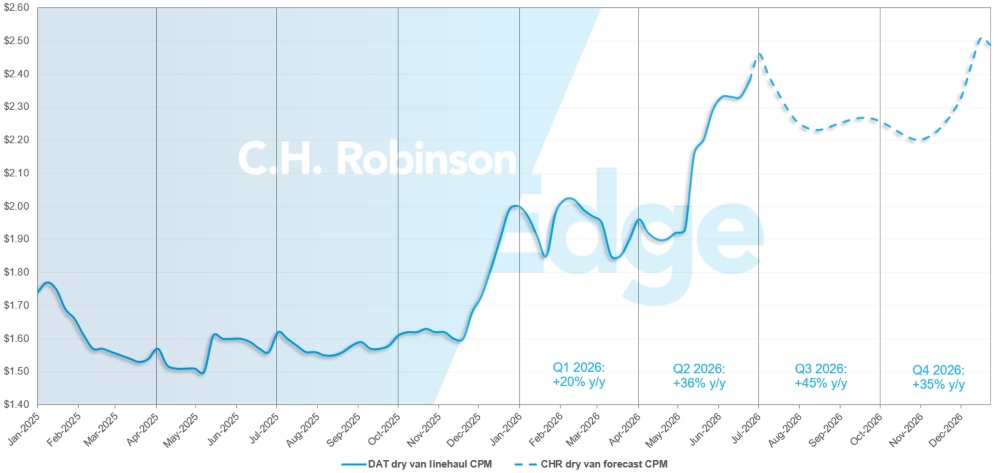
U.S. spot market forecast: Dry van truckload
The C.H. Robinson 2026 dry van cost per mile forecast is being increased to +34% y/y.
C.H. Robinson spot market dry van truckload forecast
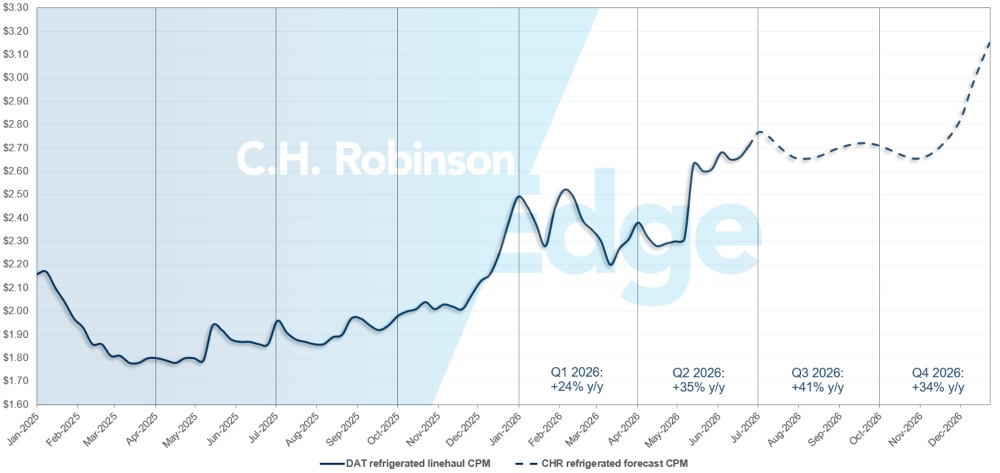
U.S. spot market forecast: Refrigerated truckload
The C.H. Robinson 2026 refrigerated van cost per mile forecast is being increased to +35% y/y.
C.H. Robinson spot market refrigerated truckload forecast
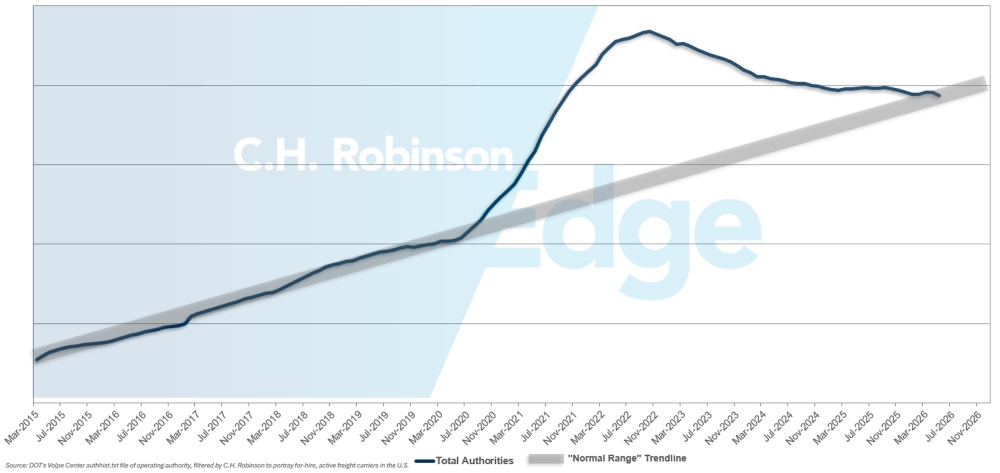
For-hire carrier authorities forecast
Carrier authority counts have returned to historical levels, reducing the excess slack that was previously available in capacity.
For-hire carrier forecast
Contract truckload environment
The following insights are derived from C.H. Robinson Managed Solutions™, which serves a large portfolio of customers across diverse industries.
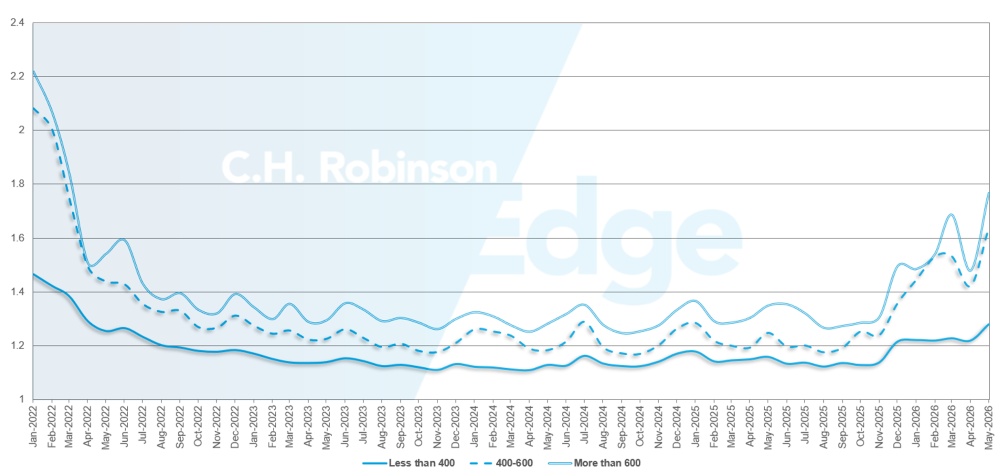
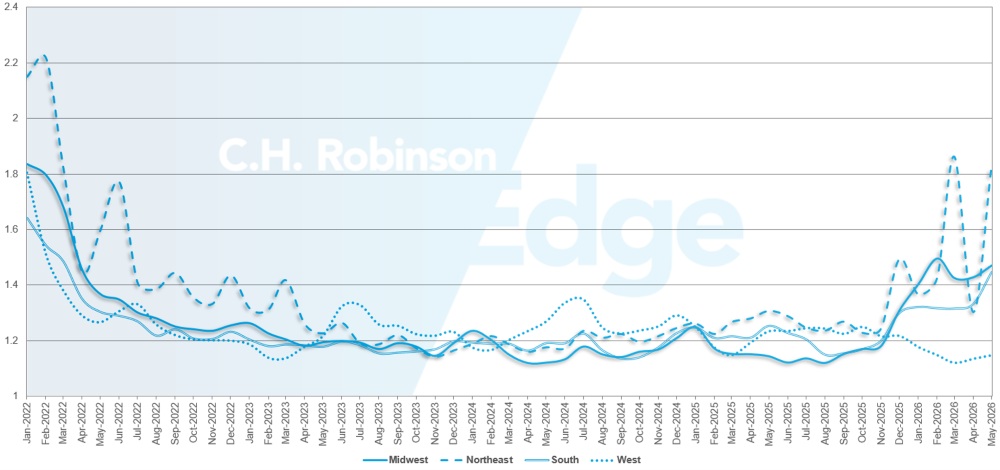
Route guide depth is an indicator of how far a shipper needs to go into their backup strategies when awarded transportation providers reject a tender. A route guide depth of 1.0 would be perfect performance, and 2.0 would be extremely poor. Route guide failures happen when the route guide has been exhausted with no preferred carriers accepting the freight, sending the shipment into the spot market.
As displayed in the following chart, the route guide depth had remained flat at a historically low level for three years (2022-2025). Beginning in late November 2025, the first signs of a changing market showed up as route guide depth surpassed 1.3 for the first time in years. Since then, route guides have remained challenged due to decreasing capacity navigating through a series of winter storms and increased diesel prices.
For the month of May, route guide depth across all North America shipments was 1.48, which is worse compared to the previous month of 1.32, reversing the improvement experienced in April and demonstrating the impact of Roadcheck Week. The 1.48 average RGD is the highest reading since 2022.
From a mileage perspective, long hauls of more than 600 miles had the worst route guide performance, with a depth of 1.78 in May. That is 20% worse compared to April 2026 (1.48), and 32% worse compared to May 2025 (1.25). This performance of long-haul shipments is indicative of the supply challenges particular to the carrier base focused on long-distance, over-the-road freight.
While shorter hauls of less than 400 miles continue to be the best route guide performers, depth for May 2026 was 1.28, which is the highest month-over-month increase for that shipment group since the first market swing in December 2025.
North America route guide depth metrics: By length of haul
Geographically, the West continued to be the best performing region, as it experienced the smallest change of all regions, worsening by 0.8% from the previous month. The Northeast experienced the worst monthly change at 40% higher than May 2025. Route guide depth is becoming stressed for all regions, varying between 1.14 and 1.84. This range is a good reminder that the U.S. freight market is not monolithic, and experience can vary by region.
U.S. route guide depth metrics: By region
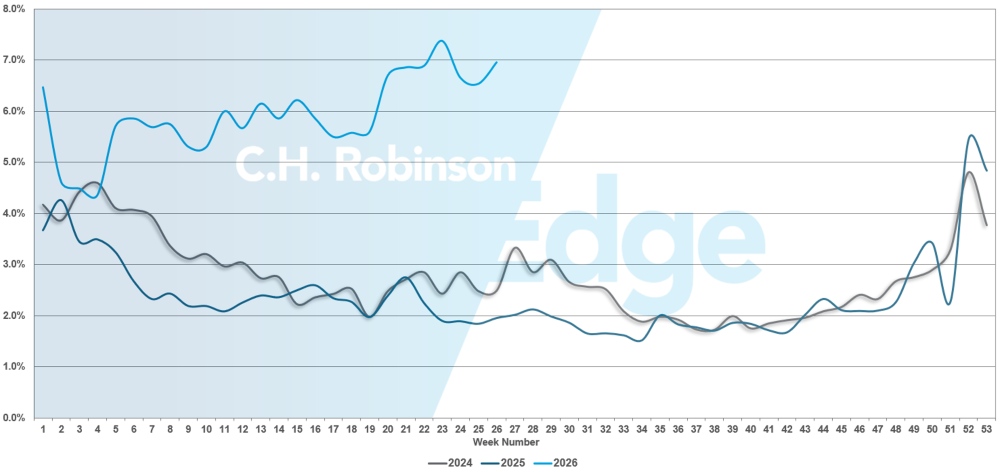
Route guide failures breached 7% in May, demonstrating the impact of 2026 Roadcheck Week on the truckload market. This is the highest route guide failure rate since the 2026 New Year’s holiday.
U.S. route guide failures
Refrigerated truckload
East Coast United States
Refrigerated conditions along the East Coast in June reflected typical seasonal pressure from produce and food-related demand, though disruptions were more measured compared to prior years. Southeastern markets remained the primary source of tightness, with capacity reacting quickly to short-term demand swings tied to produce harvesting and replenishment cycles. Northern markets experienced more balanced conditions, with sufficient capacity available outside of periodic surges.
Looking ahead, the Independence Day holiday will create a brief, predictable tightening event, with some potential last-minute shipments in outbound Southeast lanes leading up to the holiday weekend. However, once the holiday passes, seasonal demand is expected to ease as produce volumes decline out of the South. While this should reduce some upward pressure on capacity, the broader supply environment remains constrained. As a result, rate softening is likely to be gradual and less pronounced than in previous years, with shippers still needing to plan for limited flexibility and longer lead times in key lanes.
Central United States
June refrigerated activity across the central United States was defined by regional divergence. Midwest markets were generally more stable, with conditions settling closer to seasonal norms following earlier disruptions.
In contrast, Texas and surrounding South Central markets continued to experience elevated demand, driven by produce flows, cross-border shipments, and overall supply constraints. These dynamics kept both capacity and pricing elevated, particularly for time-sensitive or complex shipments.
As the market moves through July, expect the holiday to briefly increase demand across key food and beverage corridors, but attention should quickly shift to post-holiday conditions. The expected slowdown in produce season, especially out of Texas and the broader southern region, should help ease demand imbalances. However, underlying supply constraints remain a key factor across the region.
While some Central U.S. markets may see modest rate relief, Texas is likely to remain comparatively tight, and overall pricing pressure is expected to persist relative to historical seasonal patterns.
West Coast United States
Refrigerated conditions across the West Coast in June were supported by steady produce volumes and consistent outbound demand from key agricultural regions.
California and the Pacific Northwest remained active, with capacity tightening around peak harvest cycles and in major export-oriented lanes. While not as volatile as southern-origin markets, western lanes still reflected limited excess capacity, particularly for longer-haul shipments moving eastbound.
The Fourth of July holiday will create short-term tightening similar to other regions, but the broader trajectory will depend on how West Coast produce seasons transition. As harvest activity stabilizes and shifts geographically, demand should moderate slightly in key origin markets. Even so, the ongoing constrained supply environment is expected to limit the degree of rate erosion. Compared to prior years, any post-produce seasonal softening is likely to be muted, with carriers maintaining pricing discipline as capacity remains relatively tight across long-haul corridors.
Flatbed truckload
Flatbed market conditions have begun to moderate following peak building season activity. While capacity remains constrained relative to historical norms, recent indicators suggest the most acute period of tightening is likely behind. This aligns with typical seasonality, where conditions remain elevated through early summer before gradually easing into the second half of the year.
Demand signals across traditional flatbed sectors remain mixed. The National Association of Home Builders (NAHB) Housing Market Index fell to 35 in June from 37 in May, signaling continued contraction in residential construction activity. Elevated mortgage rates and ongoing affordability challenges continue to limit new home demand, creating a headwind for one of the core drivers of flatbed freight. While housing remains an important contributor, it is not currently providing meaningful growth to the market.
In contrast, industrial activity continues to offer more consistent support. Manufacturing expanded for the fifth consecutive month in May, with the ISM Manufacturing PMI reaching 54%, its strongest reading since mid-2022. While this PMI reading should not be considered a “boom,” this sustained expansion points to steady industrial production, with data center construction and other large-scale infrastructure projects providing incremental freight demand. Strength across these segments has helped offset softer residential construction activity.
Market metrics continue to reflect elevated conditions, even as signs of stabilization emerge. DAT reported flatbed spot linehaul rates increased 6.9% month over month in May, rising $0.18 per mile to $2.79 and remaining nearly 32% above prior-year levels. At the same time, national load-to-truck ratios declined through June, indicating that capacity is beginning to loosen. Despite this trend, ratios remain well above historical averages, reinforcing that overall market conditions are still tighter than normal.
Looking ahead, current trends are expected to follow typical seasonal patterns. The market should gradually ease through July as peak construction demand subsides, with broader stabilization likely as conditions move into August. Periodic regional volatility will persist, particularly in areas tied to concentrated industrial or infrastructure activity, but overall conditions are expected to become more balanced.
In this environment, planning and flexibility remain critical to maintaining service and controlling costs. These considerations continue to hold as the market transitions through seasonal shifts and regional imbalances.
- Increasing lead times where possible can improve coverage and reduce exposure to premium spot pricing
- Allowing flexibility in pickup windows and ship dates can expand available carrier options during periods of tightening
- Broadening equipment flexibility may support coverage, including utilizing step decks or Conestoga trailers alongside standard flatbeds
- Maintaining close coordination with a C.H. Robinson account manager can help monitor regional shifts and position freight effectively as conditions evolve
Voice of the Carrier
Observations from a cross-section of the contract carriers in the C.H. Robinson network—the largest in North America.
Market
- Conditions have shifted and widespread rate increases are taking place on contractual business.
- Freight selectivity is increasing, with carriers actively shedding what they consider low-quality or underperforming business and replacing it with more profitable freight.
- Networks are operating at or above capacity in many regions, leading to tighter coverage, elevated rejection rates, and increased reliance on mini-bids and dynamic repricing.
Drivers
- Driver availability remains the primary constraint, with recruitment and retention outweighing fleet growth as the top priority.
- Compensation pressure is building, with carriers implementing or preparing for pay and benefit increases.
- Turnover and churn are increasing, particularly as carriers become more selective and raise hiring standards, while owner-operator models expand in some fleets.
Equipment
- Fleet growth is largely on hold, with carriers prioritizing utilization and margin improvement over adding trucks, even in a tightening market.
- Trailer supply is becoming more constrained, with some fleets seeing a tightening balance between tractors and trailers.
- Investment is targeted and strategic, focused on modernization and high-utilization assets rather than broad expansion.
 Actionable freight insights