 Download slides
The 2027 truckload forecast is here. What comes next for rates?
Published: Thursday, September 03, 2026 | 09:00 am CDT
On this page
Spot market rates still elevated, but cooling off from summer peak
Truckload rates continue coming down from the peak levels in early July. Truckload supply pressures seem to have eased somewhat and uneven consumer spending has kept demand from rising, resulting in more of the normal seasonal trends expected at this time of year. This has prompted a modest reduction in C.H. Robinson’s full-year 2026 spot-market forecasts for both dry van and refrigerated truckload.
However, the fundamental story of the freight market remains largely unchanged. Elevated insurance costs, stricter driver requirements, federal enforcement actions, and other business challenges continue removing capacity from the market.
This creates a market that remains increasingly sensitive to disruptions. Seasonal events, weather, enforcement campaigns, and year-end shipping patterns are expected to create greater volatility than in recent years because there is less excess capacity available to absorb sudden changes in freight demand.
Introducing the 2027 C.H. Robinson truckload forecast
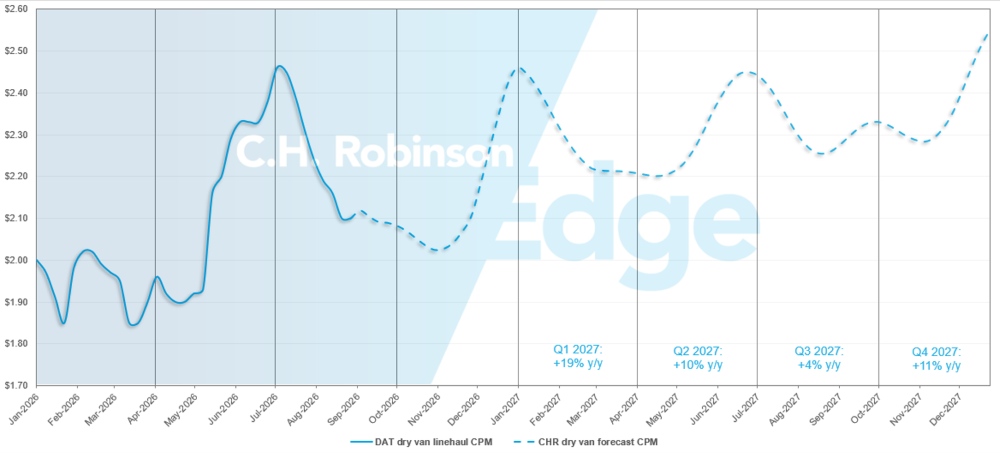
Looking ahead, C.H. Robinson forecasts the cost per mile for dry van truckload in 2027 to increase approximately 10% year over year (y/y) compared to 2026. The forecast reflects a market where freight demand remains relatively muted in the near term, but transportation supply continues to contract. As capacity exits the market, costs are expected to increase steadily through 2027, even without a significant change in underlying freight demand.
The largest y/y increases are expected during the first half of 2027, driven primarily by softer comparables against early 2026 market conditions and anticipated tightening around seasonal capacity events. Growth is expected to moderate later in the year as the market moves further into the peak phase of the freight cycle.
While economic uncertainty remains a key variable, the current outlook assumes that the contraction of trucking supply will continue to outpace freight growth, resulting in a gradually firmer pricing environment through 2027.
U.S. spot market
U.S. spot market forecast: Dry van truckload
The C.H. Robinson 2026 dry van cost-per-mile forecast is being reduced to +30% y/y, with the 2027 forecast at +10% y/y.
C.H. Robinson spot market dry van truckload forecast
U.S. spot market forecast: Refrigerated truckload
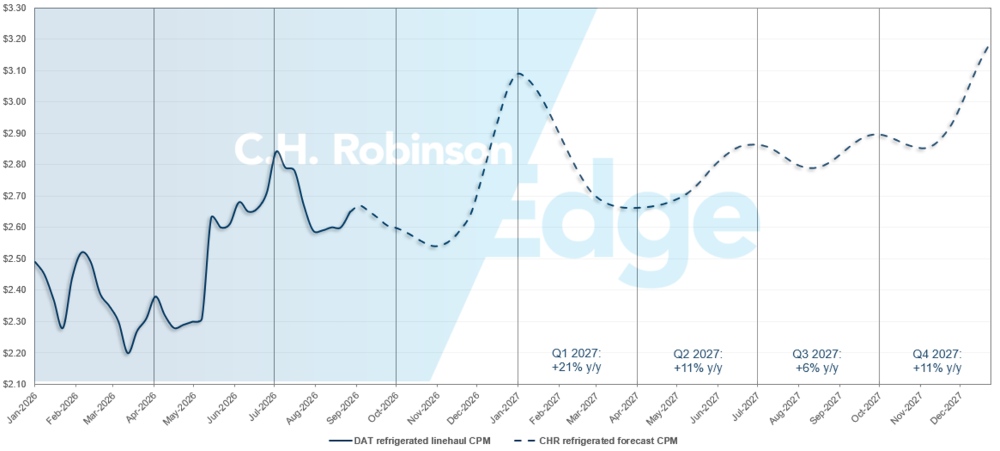
The C.H. Robinson 2026 refrigerated van cost-per-mile forecast is being reduced to +31% y/y, with the 2027 forecast at +11% y/y.
C.H. Robinson spot market refrigerated truckload forecast
U.S. spot market forecast: Flatbed truckload
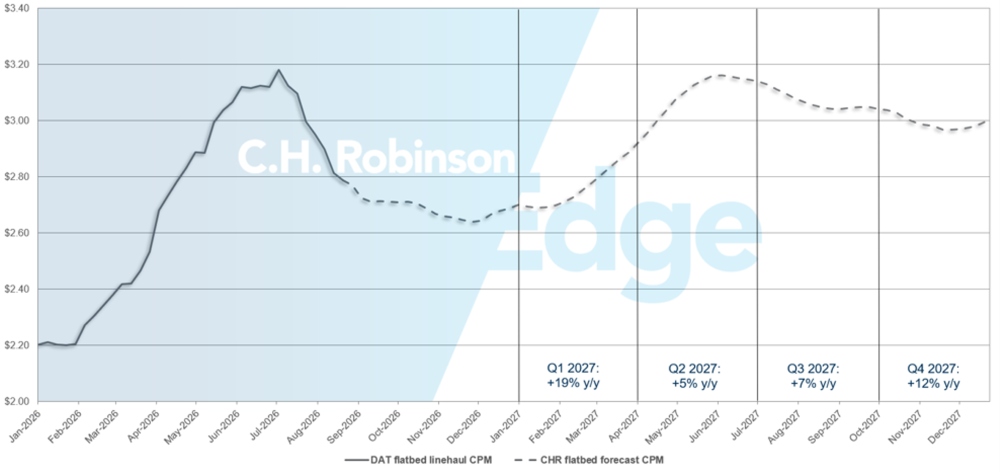
The C.H. Robinson 2026 flatbed cost-per-mile forecast is being introduced at +28% y/y, with the 2027 forecast at +10% y/y.
Flatbed forecast added for the first time
This month marks the first publication of the C.H. Robinson flatbed rate forecast.
Unlike the dry van and refrigerated markets, flatbed typically peaks during the summer construction season before softening into the fall. Recent construction spending data has been mixed, but continued investment in manufacturing, energy projects, and data center construction is helping support demand. Market conditions remain significantly stronger than the previous three years.
While rates have softened from their summer highs, current expectations call for an increase of approximately 28% y/y in 2026 and 10% y/y in 2027.
Flatbed has followed many of the same supply-side dynamics affecting truckload broadly, but seasonal patterns remain distinct. Looking ahead, rates are expected to keep gradually stabilizing through the remainder of the year. Small shifts up or down are likely as weather, regional demand, commodity flows, and project activity fluctuate.
Few indicators point toward major disruption. Continued strength in manufacturing, energy infrastructure, and industrial investment should help provide a floor for demand, while less home-building activity and the seasonal slowdown in construction should offer some relief on capacity.
C.H. Robinson spot market flatbed truckload forecast
Contract truckload environment
The following insights are derived from C.H. Robinson Managed Solutions™, which serves a large portfolio of customers across diverse industries.
Route guide depth is an indicator of how far a shipper needs to go into their backup strategies when awarded transportation providers reject a tender. A route guide depth of 1.0 would be perfect performance, and 2.0 would be extremely poor. Route guide failures happen when the route guide has been exhausted with no preferred carriers accepting the freight, sending the shipment into the spot market.
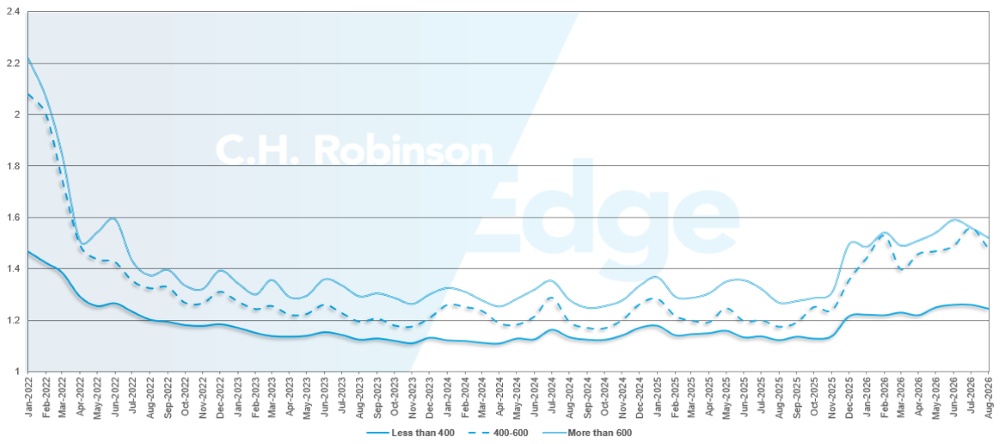
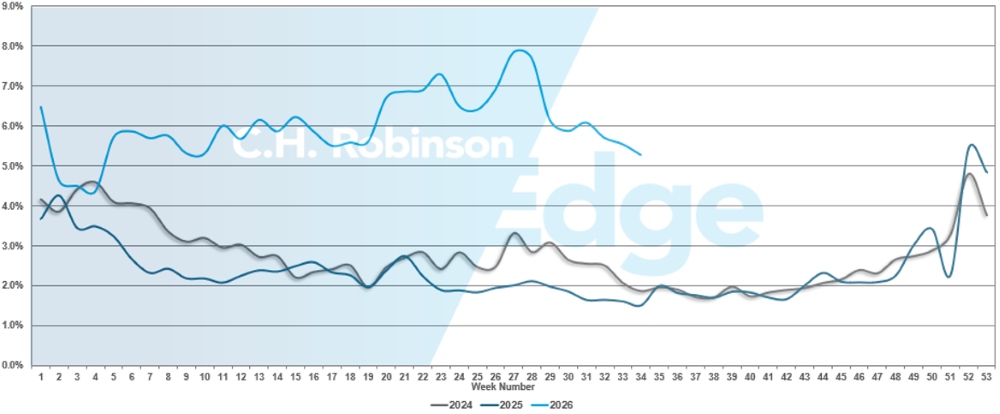
As displayed in the charts below, after three years (2022–2025) of historically calm conditions, route guide performance in 2026 has been a sign of the dynamic nature of the truckload market in 2026. During the 2026 Fourth of July holiday period when spot market pricing peaked, route guide depth and route guide failures also saw the worst performance of 2026.
Since that time, the market has calmed considerably, with route guides performing better in August than the previous two months with an average route guide depth across all North America shipments of 1.35.
North America route guide depth metrics: By length of haul
From a mileage perspective, length of haul continues to be a determining factor of route guide conditions, with shorter hauls of less than 400 miles (1.25) performing significantly better than those shipments greater than 600 miles (1.52).
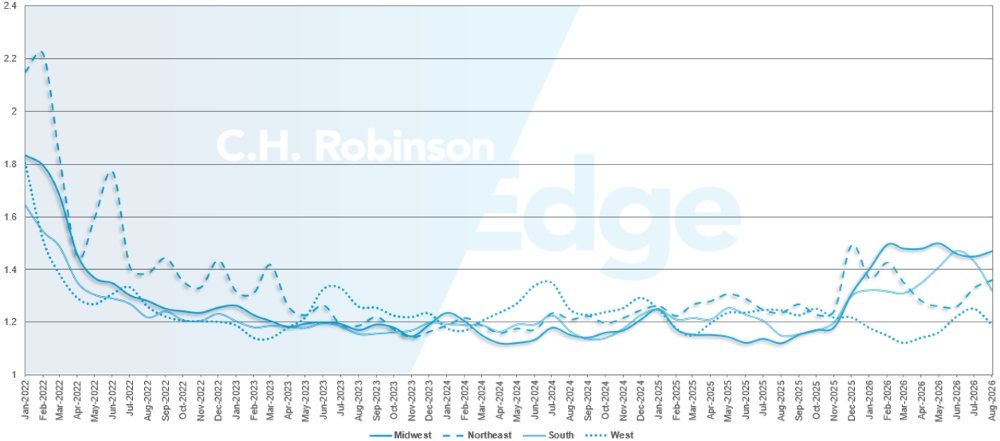
U.S. route guide depth metrics: By region
Geographically, the South experienced the largest improvement of all regions as peak produce season wrapped up, improving to 1.32 compared to 1.43 the previous month.
U.S. route guide failures
Route guide failures decreased from the peak of 7.5% during the week of July 4th, demonstrating the expected seasonal softening in the truckload market following the holiday. Failure levels remain most pronounced for longer length of haul. In August shipments more than 600 miles experienced a weekly failure average of 8.5% compared to the weekly failure average of 3.6% for shipments less than 400 miles.
While the route guide failure rate has decreased to some of the softest levels in the past three months, it remains significantly higher than previous years’ levels.
Refrigerated truckload
The refrigerated truckload market is undergoing a significant seasonal transition as produce harvests shift north across the United States. While overall market conditions remain balanced between trucking supply and demand, freight demand and pricing trends are increasingly diverging between northern and southern growing regions.
Throughout the third quarter, northern markets have experienced a meaningful tightening of refrigerated capacity. The outbound load-to-truck ratio in northern regions has increased two to three times compared to early summer levels, while spot rates have climbed by double-digit percentages.
Much of this activity is being driven by seasonal harvest cycles. Commodities such as potatoes, onions, sweet corn, apples, cherries, and other late-summer produce are increasing outbound freight demand across the Upper Midwest, Pacific Northwest, Great Lakes, and other northern agricultural regions. As these harvests accelerate, competition for refrigerated equipment has intensified and carriers have been able to command stronger pricing.
The opposite trend has emerged across much of the South. As growing seasons wind-down in produce regions, freight demand has softened considerably. Markets that earlier in the year had shipments of watermelons, berries, tomatoes, citrus, and other produce are now experiencing significantly lower freight activity. Out of the southern markets, load-to-truck ratios have fallen to one-third to one-half of their early summer levels. This has contributed to lower spot pricing and improved capacity.
Looking ahead, these seasonal patterns are expected to continue. Freight originating in northern regions traditionally experiences strengthening cost-per-mile trends through the remainder of the harvest season, even as load-to-truck ratios begin to level off. The combination of harvest activity, seasonal food demand, and year-end shipping patterns are primary drivers.
Meanwhile, the load-to-truck ratio out of southern markets is expected to reach its annual low point during September before gradually rising. Capacity availability and pricing in these regions are expected to stabilize and follow more traditional seasonal patterns through the remainder of the year.
C.H. Robinson 2027 refrigerated truckload forecast
This month also marks the release of the C.H. Robinson 2027 refrigerated truckload forecast. Current expectations call for refrigerated truckload rates to continue to rise on a y/y basis throughout 2027. The largest increases are expected during the first half of the year, due to relatively soft comparisons from early 2026 and tighter capacity across the trucking industry, then may taper down as the year progresses.
Flatbed truckload
The C.H. Robinson 2027 flatbed forecast and contributing factors are provided above. Below are additional insights influencing flatbed freight.
Manufacturing activity provided a stronger signal in July, with the ISM Manufacturing PMI rising to 55.6 from 53.3 in June, the strongest expansion reading since May 2022. The improvement reinforces the industrial momentum (i.e., AI infrastructure, energy projects, industrial development, etc.) currently supporting flatbed demand.
Residential construction remains a moderating force. Builder confidence improved modestly in August but remains below levels typically associated with favorable housing conditions. Current sales, future expectations, and buyer traffic continue to suggest limited near-term growth from housing and building products.
Other industrial sectors continue to provide support. According to the U.S. Energy Information Administration, renewable energy generation expanded meaningfully during the first half of 2026, with solar, hydropower, and wind generation increasing 21%, 9%, and 6%, respectively, compared to the same period last year. Ongoing investment in renewable energy, transmission infrastructure, and grid modernization is expected to generate additional project-freight demand through 2027.
Flatbed spot linehaul rates declined 1.6% month over month in July to $2.90 per mile. While rates have moved off their summer highs, pricing remains elevated relative to historical averages, suggesting capacity conditions remain considerably tighter than in recent years. Even as conditions become more predictable, maintaining visibility into regional trends remains important. Weather, trade policy, geopolitical developments, and shifts in industrial investment can quickly alter freight flows and pricing dynamics.
Voice of the Carrier
What are asset-based carriers saying about the current freight environment? These are observations from a cross-section of the contract carriers in the C.H. Robinson network—the largest in North America.
Market
- Capacity continues to tighten, with elevated tender rejections and growing carrier selectivity.
- Dedicated and round-trip freight continue to be favored over transactional freight, with many carriers prioritizing long-term commitments and network efficiency.
- Carrier bankruptcies, regulatory enforcement, and the resulting tighter capacity are expected to support a firmer pricing environment over the coming quarters.
- Insurance remains one of the fastest-growing operating expenses, with several carriers reporting double-digit increases and significantly higher deductibles.
Drivers
- Federal enforcement actions continue to reduce the pool of available drivers, even for carriers not directly impacted by tighter CDL regulations.
- Carriers are maintaining higher hiring standards and seeking experienced, reliable operators. Recruiting and retaining qualified drivers remains a challenge, despite increased recruiting budgets, referral programs, and wage investments.
- Additional driver pay increases are anticipated across portions of the industry as carriers work to remain competitive.
Equipment
- Fleet growth remains limited. Most carriers are focused on higher utilization of existing equipment, replacement as needed, and using trucks for dedicated opportunities rather than adding significant truck capacity.
- Trailer counts are under increased scrutiny, with some carriers reducing trailer inventories and controlling assets more tightly.
- Maintenance and parts costs continue to impinge on profitability, although availability issues have largely eased compared to prior years.
 Actionable freight insights