Research: Key Factors that Lead to
High-Performing LTL Shipments
Don’t fight the LTL market—plan for it
Shippers and LTL carriers have very different perspectives on how the LTL operational model actually works. There are basic underlying factors that constrain (1) geographic hub and spoke LTL networks for cross-country deliveries and (2) local pickup and delivery networks for LTL.
This research explains how shippers’ freight attributes and practices contribute to LTL performance—for better or worse. Shippers of any size can use these insights to better manage expectations for LTL performance—on time pickup (OTP) and on time delivery (OTD).


Shipment weight matters
LTL carriers create a plan to serve multiple shippers and receivers in a truck’s route. The carrier uses the actual freight weight, actual cube, and/or the number of pallets when planning routes to optimize pallet positions on the trailer.
There are many reasons why it’s smart for LTL carriers to know what the actual shipment weights and cube are up front, including the fact that not knowing can lead to shipment delays.
Imagine that an LTL driver arrives at the first shipper location on their pickup route, expecting to pick up a 600 pound shipment that uses three pallet positions. Instead, the shipment weighs 2,000 pounds and uses 10 pallet positions. Because the driver has an empty truck at the time, he or she can take this load. But somewhere along the route, the truck will fill earlier than planned, and someone’s shipments toward the end of the route will be delayed. The LTL carrier may be able to divert another driver or send someone from the terminal to pick up the overflow, but this adds an element of variability to the ability to complete the pickup on time.
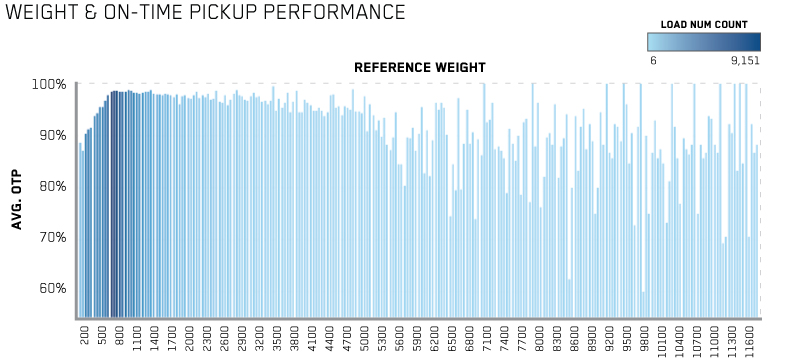
In addition, the research shows that specific weight ranges are likely to have better OTP and OTD performance. In the graphic below, the darker shading for a weight range represents a higher volume of shipments. The height of the bar represents the average OTP.
| Shipment Weight (lbs) | On Time Pickup % Min/Max |
On Time Delivery % Min/Max |
|---|---|---|
| 0-500 | 86/95 | 64/90 |
| 501-1,000 | 94/95 | 90/91 |
| 1,001-2,000 | 94/95 | 90/91 |
| 2,001-5,000 | 84/96 | 82/90 |
LTL carriers try to maximize both weight and orders simultaneously. Shipments that weigh roughly 1,000 pounds appear to be the most optimal for guaranteed performance. Anything lighter may be neglected, since the carrier may be trying to fit those shipments in at the end of the truck’s space availability, or to top load the freight on the truck. By using this flexible approach, the LTL carrier can increase the truck's load factor and subsequently, the revenue and profitability of the truck.
In contrast, shipments over 5,000 lbs. are low density, inconsistent, and unpredictable. The data shows that these shipments see more LTL performance variance at pickup and delivery. Shipments of this size consume more space in an LTL trailer, which also makes it harder for LTL carriers to optimize the trailer and load freight from many shippers/consignees on the trailer. Given the choice, it appears that LTL providers choose being late for one shipper, rather than being late for two or three shippers with smaller, more traditional LTL freight.
Takeaways:
- If your location is far from an LTL terminal, call early for pickup. Drivers on a routine route cannot backtrack without impacting on time performance for all subsequent pickups.
- Provide the LTL carrier with accurate weight and cube details on shipment tenders for best results.
- If your shipment weighs more than 5,000 pounds, make special arrangements with the LTL carrier for pickup. Heavier shipments may require dedicated equipment, and may be subject to high-cost accessorials.
▴ Back to top of page ▴
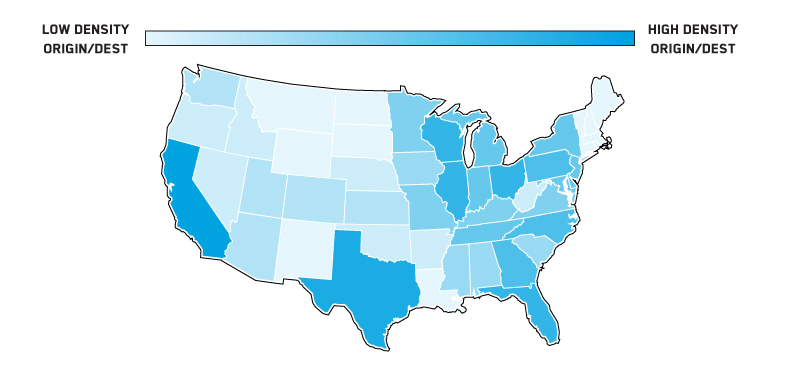
Busy economic and freight corridors perform best
Lower volume corridors tend to be more challenging for planning and optimizing routes.
Shipments made up of fewer pallets going to high volume destinations are the most likely to experience better performance—that is, to have both on time pickup and on time delivery.
Intuitively, it makes sense that shipments to higher volume regions with shorter published transit days correlate with higher on time deliveries. The more shipments are moving to a certain area, the more opportunities there are for continuous improvement. Shorter published transit days not only reduce the number of terminals the freight must go through, which eliminates handling and wait times, but also reduce potential delays while the goods are in the carrier’s hands.
Takeaways:
- Adjust performance expectations for lightly used economic and freight corridors. Lightly traveled lanes are less likely to have high performance.
▴ Back to top of page ▴
Origins further from the LTL terminal have better on time pickup
Origin locations further from the LTL terminal perform best in on time pickup (OTP). Origins located closer to the terminals may prove more challenging for route and hours planning. It appears that outlying points might not optimize perfectly every day, leading to some OTP and on time delivery (OTD) variability. Distance from the delivering terminal to the consignee is not statistically significant.
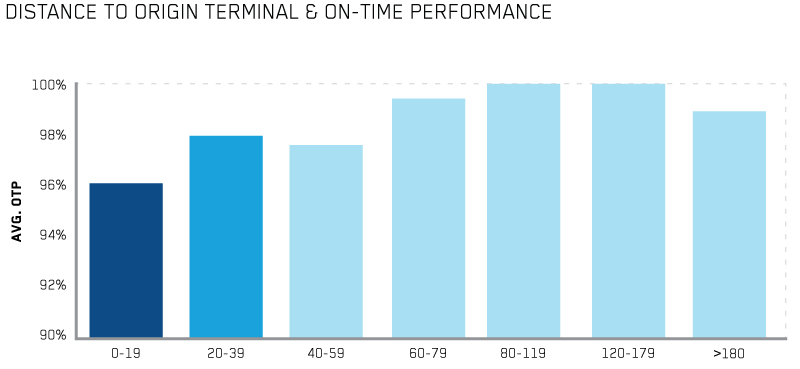
When an LTL driver performs a pickup route, they typically begin with the furthest shipments away from the terminal and work back toward the LTL terminal. Experientially, closer shipments are more likely to be bumped due to lack of space in the trailer. Despite this, being closer to the terminal means that a shipper has a better chance that a second truck can still come and pick up the shipment on the requested day.
▴ Back to top of page ▴
Factors that make on time delivery more likely
These variables also lead to better on time delivery performance for LTL shipments:
- On time pickup. High pickup performance likely indicates better shipment management (e.g., a well-organized outbound dock) and better shipper-carrier relationships. Shipments that pick up on time are more likely to deliver on time.
- Published transit days. Shipments to higher volume corridors tended to have higher on time delivery performance. Shippers saw better performance when located closer to customers (lower published transit days). Single-day transits from shipper to consignee perform better than multi-day. This is likely because the longer the length of haul, the more chance there will be for weather delays, traffic, and other issues to have an impact on performance.
▴ Back to top of page ▴
What causes LTL underperformance?
SPECIAL REQUIREMENTS
| Accessorial | Total Counts | OTP | OTD |
|---|---|---|---|
| Hazmat | 7,299 | 95% | 67% |
| Liftgate | 5,685 | 83% | 62% |
Liftgate and hazmat shipments tended to underperform, especially at delivery.
Liftgates are needed to deliver to homes or non-commercial locations. However, many LTL terminals don’t have liftgate equipment available at all times to address these shipments. Scheduling is required. If loads require these resources, they may have to wait for the equipment to become available, causing variance in performance.
Hazmat goods are subject to regulations by many governmental agencies. These regulations, which protect the public’s health and safety, can reduce the carrier’s flexibility. There are specific loading practices for hazmat and rules about the types of freight that cannot be comingled with hazmat, such as food grade/foodstuffs. As a result, LTL terminals likely struggle to comingle hazmat freight with other commodities and create effective routes. It may take time to identify freight mixes that can be comingled with hazmat, slowing deliveries.
At origin, LTL carriers know the requirements of a shipper’s freight. They can plan for hazmat freight to be comingled with other commodities they know will arrive before the scheduled pickup date. And, they have a great deal of flexibility to schedule equipment from a pool for the pickup and to adjust routes.
Takeaways:
- Shippers should discuss special requirements with LTL carriers to understand what causes them to take the freight out of the service standard. Find out what special requirements do and do not delay shipments—or what could potentially delay shipments.
▴ Back to top of page ▴
What you can do for better LTL performance
- Base your performance expectations on the LTL carrier’s published transit days +1. Be aware that the carrier's published transit days represent the case where everything in the schedule goes right. More days may be required for LTL shipments than shippers currently allow—which can lead to poor performance. Carrier transit times are not the same as total time from pickup to delivery because that timeline does not allow for scheduling and consignee requirements. Research shows that shippers who base expectations on the LTL carrier’s published transit days achieve 71% OTD. This lower performance incorporates all shipments, including the ones with tender codes that stopped service for reasons beyond the carrier's control. Shippers who take the impact of tender codes into account and use published transit days +1 achieve 91% OTD.
- Be accurate on tender details. LTL carriers plan multiple-pick loads based on the tendered information and/or historical experience. Shippers who underestimate pallet counts or shipment weight can find their pick rejected because the carrier wasn’t able to plan ahead for the space that would be used on the trailer. Also ensure you provide the carrier with any special requirements; they can plan pickup routes more effectively when they know this information.
- Choose best-performing suppliers for the best on time performance. Carriers with a pattern of high performance showed across multiple shippers in this research. National and regional LTL carriers have similar levels of performance. Small shippers (<25,000 loads per year) did better with regional carriers; they also had slightly shorter length of hauls. Large shippers (25,000-100,000 loads per year) experienced slightly better service from national carriers than regional; they had slightly longer shipments. Mega shippers (100,000+ loads per year) experienced strong performance from both national and regional LTL carriers.
- Segment your supply chain or customers by requirements. Use premium LTL carriers to serve your top customers and standard service levels for customers who are more focused on cost than service.
▴ Back to top of page ▴
About the study
This research report summarizes a thesis entitled, “A Study of Shipper Performance in the Less-Than-Truckload Market.” The thesis was published in 2018 by Bin Yin and Christos Rallis, graduate students at MIT’s College of Transportation and Logistics program, advised by Dr. Chris Caplice. The students also worked with a team from C.H. Robinson and TMC, a division of C.H. Robinson, including Steve Raetz, Greg West, Jack Carney, Glenn Koepke, Andy Welch, Ege Demirel, and Nic Biondolillo.
Analyzed actual TMC data from 947,000 outbound shipments in the contiguous 48 U.S. states.
- Volume threshold of carriers who received 5,000 shipments or more from January 2016 to October 2017 (a 22 month period)
- The most common shipment weight range: 600-800 lbs.
- Number of pallets: 1 pallet, 60% of shippers; 1-2 pallets, 85% of shippers
Clustering and regression methodologies
- 12 primary variables were used for 33 shippers in the Automotive, Manufacturing, Food and Beverage industries
- 433 shipping locations
- 26 carriers
We can help you become a leader
Our Process Consulting team can help you choose high-performing suppliers and build a more efficient route guide. We use a neutral approach to blend the best that asset carriers and brokers have to offer in your specific lanes. Our Solution Design team can help you develop more efficient processes. We create process maps that reveal your best opportunities for saving time and money in the supply chain.